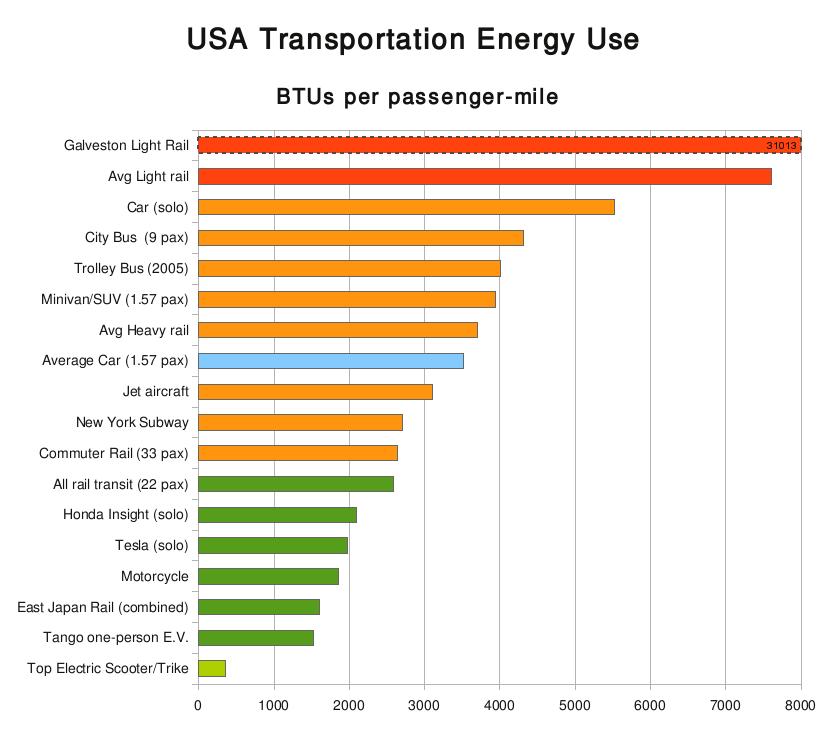
Transit energy chart updated from latest DoE book
Submitted by brad on Mon, 2010-03-29 16:18
Topic:
Back in 2008 I wrote a controversial article about whether green transit was a myth in the USA. Today I updated the main chart in that article based on new releases of the Department of Energy Transportation Energy Fact Book 2009 edition. The car and SUV numbers have stayed roughly the same (at about 3500 BTUs/passenger-mile for the average car under average passenger load.)
What's new?
- Numbers for buses are now worse at 4300. Source data predates the $4/gallon gas crisis, which probably temporarily improved it.
- Light (capacity) rail numbers are significantly worse -- reason unknown. San Jose's Light rail shows modest improvement to 5300 but the overall average reported at 7600 is more than twice the energy of cars!
- Some light rail systems (See Figure 2.3 in Chapter 2) show ridiculously high numbers. Galveston, Texas shows a light rail that takes 8 times as much energy per passenger as the average SUV. Anybody ridden it and care to explain why its ridership is so low?
- Heavy rail numbers also worsen.
- Strangely, average rail numbers stay the same. This may indicate an error in the data or a change of methodology, because while Amtrak and commuter rail are mildly better than the average, it's not enough to reconcile the new average numbers for light and heavy rail with the rail average.
- I've made a note that the electric trike figure is based on today's best models. Average electric scooters are still very, very good but only half as good as this.
- I've added a figure I found for the East Japan railway system. As expected, this number is very good, twice as good as cars, but suggests an upper bound, as the Japanese are among the best at trains.
- I removed the oil-fueled-agriculture number for cyclists, as that caused more confusion than it was worth.
- There is no trolley bus number this year, so I have put a note on the old one.
- It's not on the chart, but I am looking into high speed rail. Germany's ICE reports a number around 1200 BTU/PM. The California HSR project claims they are going to do as well as the German system, which I am skeptical of, since it requires a passenger load of 100M/year, when currently less than 25M fly these routes.


Comments
Stranger
Thu, 2010-04-01 10:27
Permalink
Galveston Streetcars
You asked why Galveston streetcars have such high energy use per passenger. This is because Galveston's streetcars aren't really mass transit.
http://en.wikipedia.org/wiki/Galveston_Island_Trolley
These are historic looking artifacts to enhance the historic district of the Island. There are 4 cars that carry 80 passengers each, and run between The Strand and the seawall (6.8 m run). Currently not in operation because of Ike, but when running there was 1 on weekdays, 2 on weekends. They are primarily used by tourists, with some use by University of Texas Medical Branch staff. So, in summary:
1. Low use by residents (doesn't go anywhere).
2. Low number tourists (Galveston just isn't that busy).
3. Short run length (6.8 m).
4. Small street cars (low capacity, 80 per car).
brad
Thu, 2010-04-01 19:26
Permalink
Makes sense
I will probably revise things to not put Galveston as the poster child for a light rail error. Kenosha and Memphis are also very short loops though less aimed at tourists.
This is good because the numbers for Galveston were so crazy that it was hard to imagine even transit planners goofing up that much. Seems more like a tourist board.
Add new comment